Guides
Why does the “best” lottery-picking method always find something?
· Updated: Pewniaki.pl

In brief
Lotto and Multi Multi statistics describe past draws; they do not identify the next winners. We examined three complete months, 1 July–30 September 2026. Across 39 Lotto draws, 18 and 38 appeared most often, nine times each. In 184 Multi Multi draws, 58 led with 60 appearances. These are historical observations, not recommended picks.
Why does the best lottery-picking method always find something?
Compare dozens of methods across hundreds of windows and a strong-looking result will often emerge. Selecting the winner after seeing its hits measures fit to the past. “You only needed to play these numbers” leaves out unsuccessful trials and the cost of all tickets. “Always” in the title is shorthand: more trials increase the chance of finding an impressive result, without guaranteeing one.
What do recent results show?
The monthly leaders changed. Lotto was led by 9 in July, 27 in August, and jointly by 1, 41 and 46 in September. Multi Multi leaders were 78, 58 and 12. The table includes every tied leader. The charts show frequencies across the full number pools, including less striking results rather than only the winners of the rankings.
| Game | Month 2026 | Draws | Leaders | Appearances each | Share |
|---|---|---|---|---|---|
| Lotto | July | 13 | 9 | 5 | 38.46% |
| Lotto | August | 13 | 27 | 5 | 38.46% |
| Lotto | September | 13 | 1, 41, 46 | 4 | 30.77% |
| Multi Multi | July | 62 | 78 | 23 | 37.10% |
| Multi Multi | August | 62 | 58 | 23 | 37.10% |
| Multi Multi | September | 60 | 12 | 22 | 36.67% |
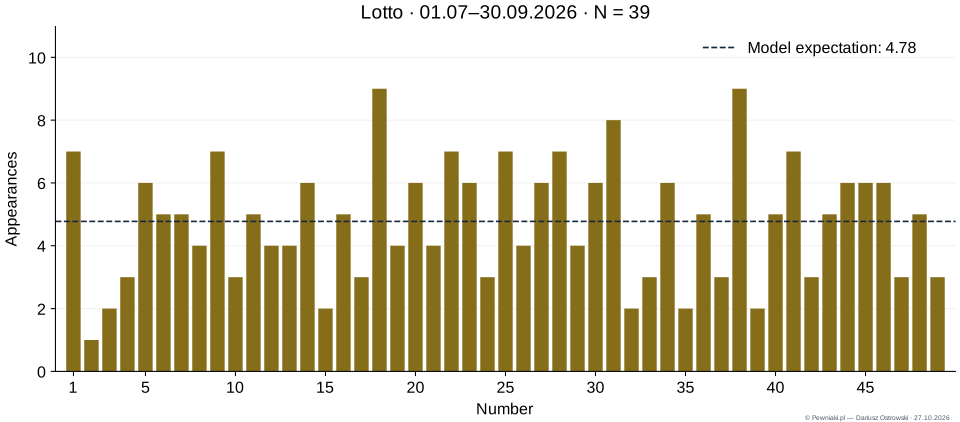
Exact chart data — Lotto
| Number | Appearances |
|---|---|
| 1 | 7 |
| 2 | 1 |
| 3 | 2 |
| 4 | 3 |
| 5 | 6 |
| 6 | 5 |
| 7 | 5 |
| 8 | 4 |
| 9 | 7 |
| 10 | 3 |
| 11 | 5 |
| 12 | 4 |
| 13 | 4 |
| 14 | 6 |
| 15 | 2 |
| 16 | 5 |
| 17 | 3 |
| 18 | 9 |
| 19 | 4 |
| 20 | 6 |
| 21 | 4 |
| 22 | 7 |
| 23 | 6 |
| 24 | 3 |
| 25 | 7 |
| 26 | 4 |
| 27 | 6 |
| 28 | 7 |
| 29 | 4 |
| 30 | 6 |
| 31 | 8 |
| 32 | 2 |
| 33 | 3 |
| 34 | 6 |
| 35 | 2 |
| 36 | 5 |
| 37 | 3 |
| 38 | 9 |
| 39 | 2 |
| 40 | 5 |
| 41 | 7 |
| 42 | 3 |
| 43 | 5 |
| 44 | 6 |
| 45 | 6 |
| 46 | 6 |
| 47 | 3 |
| 48 | 5 |
| 49 | 3 |
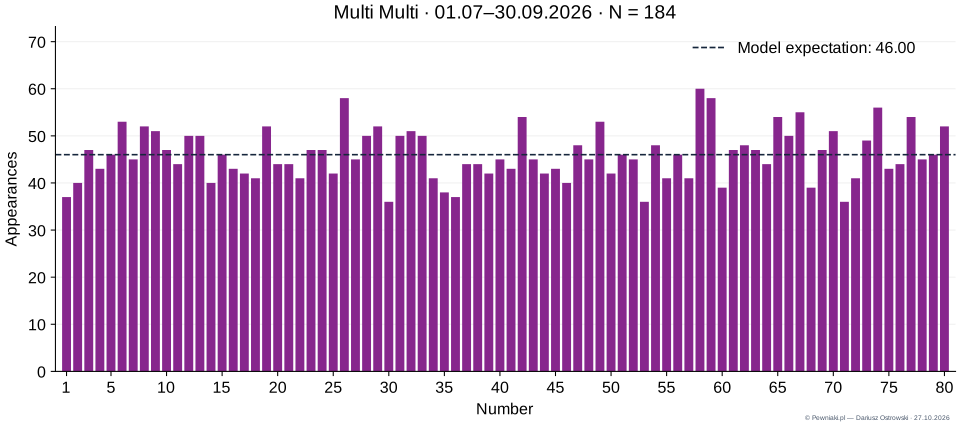
Exact chart data — Multi Multi
| Number | Appearances |
|---|---|
| 1 | 37 |
| 2 | 40 |
| 3 | 47 |
| 4 | 43 |
| 5 | 46 |
| 6 | 53 |
| 7 | 45 |
| 8 | 52 |
| 9 | 51 |
| 10 | 47 |
| 11 | 44 |
| 12 | 50 |
| 13 | 50 |
| 14 | 40 |
| 15 | 46 |
| 16 | 43 |
| 17 | 42 |
| 18 | 41 |
| 19 | 52 |
| 20 | 44 |
| 21 | 44 |
| 22 | 41 |
| 23 | 47 |
| 24 | 47 |
| 25 | 42 |
| 26 | 58 |
| 27 | 45 |
| 28 | 50 |
| 29 | 52 |
| 30 | 36 |
| 31 | 50 |
| 32 | 51 |
| 33 | 50 |
| 34 | 41 |
| 35 | 38 |
| 36 | 37 |
| 37 | 44 |
| 38 | 44 |
| 39 | 42 |
| 40 | 45 |
| 41 | 43 |
| 42 | 54 |
| 43 | 45 |
| 44 | 42 |
| 45 | 43 |
| 46 | 40 |
| 47 | 48 |
| 48 | 45 |
| 49 | 53 |
| 50 | 42 |
| 51 | 46 |
| 52 | 45 |
| 53 | 36 |
| 54 | 48 |
| 55 | 41 |
| 56 | 46 |
| 57 | 41 |
| 58 | 60 |
| 59 | 58 |
| 60 | 39 |
| 61 | 47 |
| 62 | 48 |
| 63 | 47 |
| 64 | 44 |
| 65 | 54 |
| 66 | 50 |
| 67 | 55 |
| 68 | 39 |
| 69 | 47 |
| 70 | 51 |
| 71 | 36 |
| 72 | 41 |
| 73 | 49 |
| 74 | 56 |
| 75 | 43 |
| 76 | 44 |
| 77 | 54 |
| 78 | 45 |
| 79 | 46 |
| 80 | 52 |
The page content remains available.
How can you compare Lotto and Multi Multi?
Lotto draws 6 numbers from 49; Multi Multi draws 20 from 80. A particular number therefore has approximately a 12.24% or 25% chance of appearing in a draw. Raw hit counts between the games are not directly comparable. The model expects 4.78 appearances per Lotto number and 46 per Multi Multi number in this sample. These are expectations, not limits or promises that overdue numbers will catch up.
| Game | Numbers drawn | One-number probability | Expected appearances in sample |
|---|---|---|---|
| Lotto | 6 / 49 | 12.24% | 4.78 / 39 |
| Multi Multi | 20 / 80 | 25% | 46 / 184 |
Do frequent numbers improve your chance of winning?
A historical ranking alone does not improve the chance in an independent draw. Every fixed six-number Lotto combination has the same jackpot chance: 1 in 13,983,816. In Multi Multi, one observed number appearing does not necessarily mean a winning ticket: the selection size and game variant matter. “Hot” and “overdue” labels can organise observations, but do not demonstrate an advantage.
How can you test a method fairly?
Record the rule, training window and selection size first. Then evaluate it on subsequent draws that were not used to select those settings. In a rolling evaluation, each selection uses earlier data only. Compare it with random selections of the same size, count every trial and include the cost of playing. A high hit count and a profit after stakes are different outcomes.
How can newspapers cite these statistics?
Analysis by Pewniaki.pl, updated 27 October 2026. Source: the website’s public archive; period 1 July–30 September 2026, Polish local time. Sample: 39 Lotto and 184 Multi Multi draws, 223 in total. We checked scheduled draws, duplicates, ball counts and valid ranges. Only main numbers are counted; Plus is not an additional appearance. Each percentage is appearances divided by draws. This descriptive analysis does not establish a statistical anomaly.
Why play the lottery?
There is a chance of winning, and that possibility can be exciting. You must enter to win, but this does not mean everyone should play or that statistics will deliver an income. If you choose to play, treat it as paid entertainment, set a budget and never chase losses. For adults, these analyses can also be an engaging lesson in probability without buying a ticket.
Will the best method from the last three months work next month?
A historical ranking cannot establish that. Freeze the selected method's settings and evaluate later draws, reporting costs and the results of the other methods tested as well.
Tags: lottery-picking method lottery randomness Multi Multi statistics most frequent numbers multiple testing